PILINGSOFTBY VENTRALIA Book a demo
PILINGSOFT › Modules › Office and analytics
Module 04 — Office and analytics

The month closes from what was written, not from what is remembered.

Timesheets, the daily report, output and cost analytics — built from the same events the site already recorded, so nothing is entered a second time.

1tap to mark a shift
8weeks of trend, by stage
0month-end reconstruction
How the work runs

From the shift marked at 07:00 to the month that closes itself.

Gangs and crews

Who works in which gang, on which shift, from which date. Subcontractor crews are marked, because their reconciliation is a different conversation.

Timesheets

Attendance is one tap per person per shift. Anything harder than that gets done at the end of the week, from memory.

Daily report

What was produced, what stopped, what arrived and what happened — written on the day, mostly from records that already exist.

Analytics

Where the time actually goes: which stage is slow, which custody holds the queue, which SLA is breached and by how long.

Output

Reports and PDFs that can be handed to the client, the auditor or the subcontractor without editing anything first.

What it records

Crews, timesheets, daily report and analytics.

Crew

  • Gangs, shifts and members
  • Joining and leaving dates
  • Subcontractor crews, marked
  • Overtime and calendars

Timesheets

  • One tap per person per shift
  • Present, absent, on leave
  • Reconciliation by gang
  • Monthly totals per contractor

Daily report

  • Production for the day
  • Incidents and stoppages
  • Weather and site conditions
  • Signed off and archived

Analytics

  • Time per stage and per custody
  • SLA breaches and how long
  • Eight-week trend
  • Where the queue is standing right now

Reports

  • Production and progress
  • Stock and custody
  • Export to Excel
  • PDF for the client file
From the working product
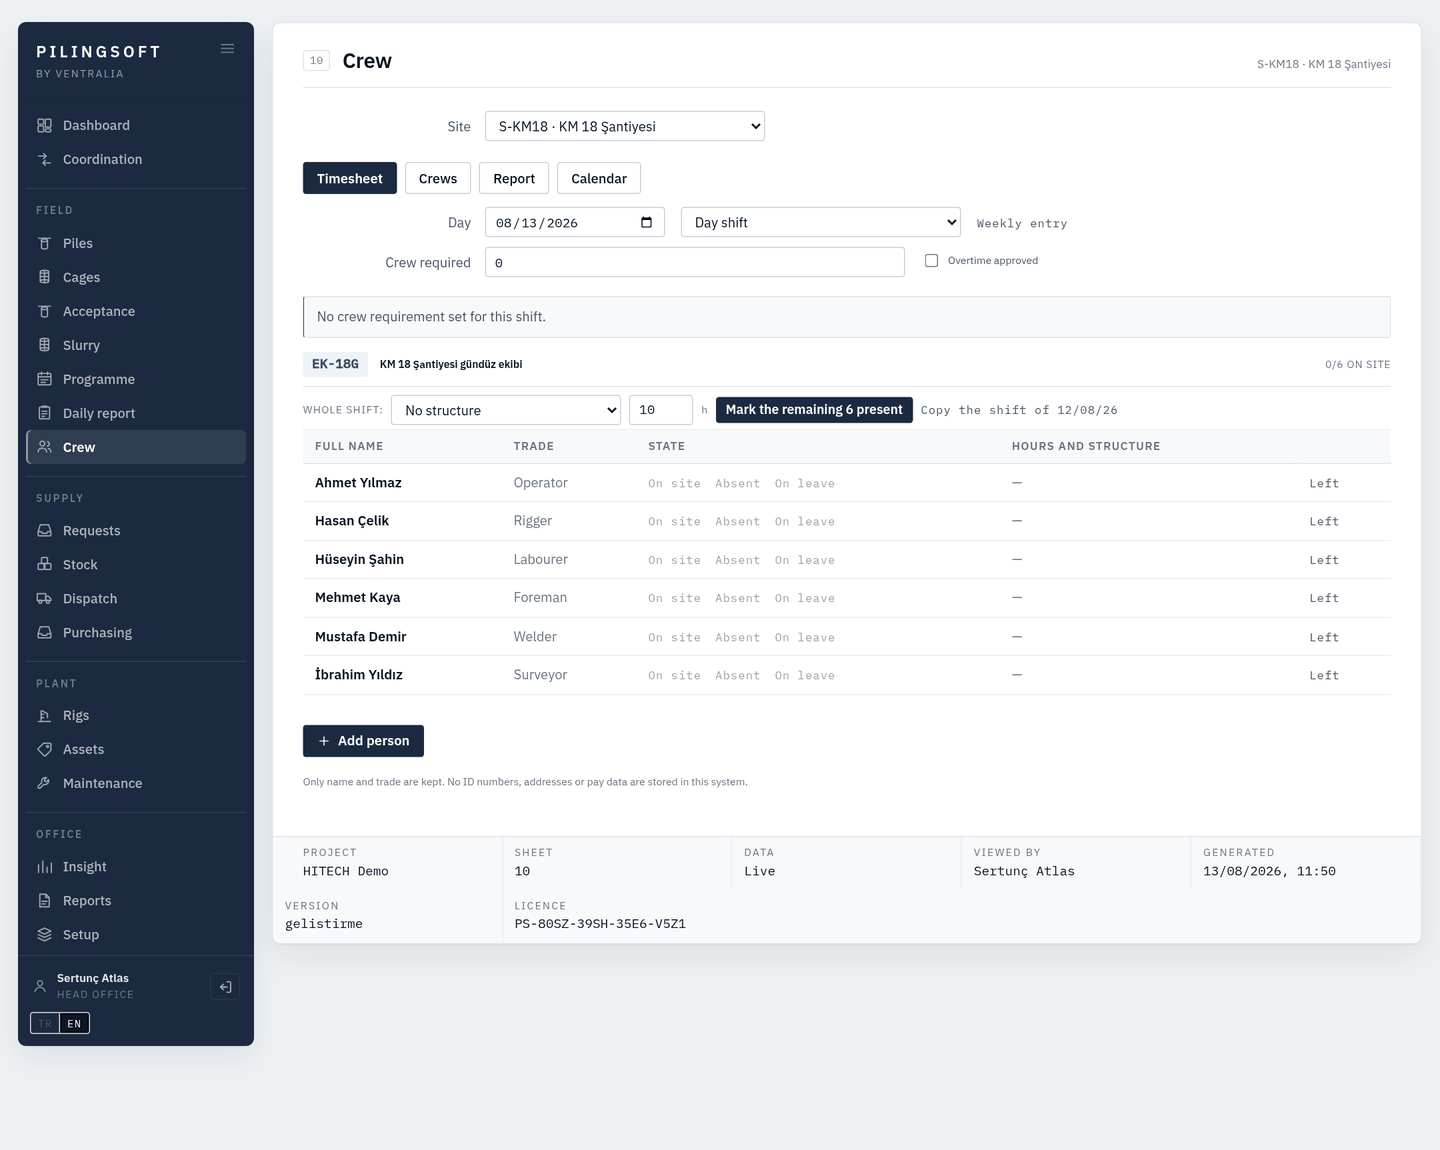
Crew — gangs, shifts and attendance in one tap.
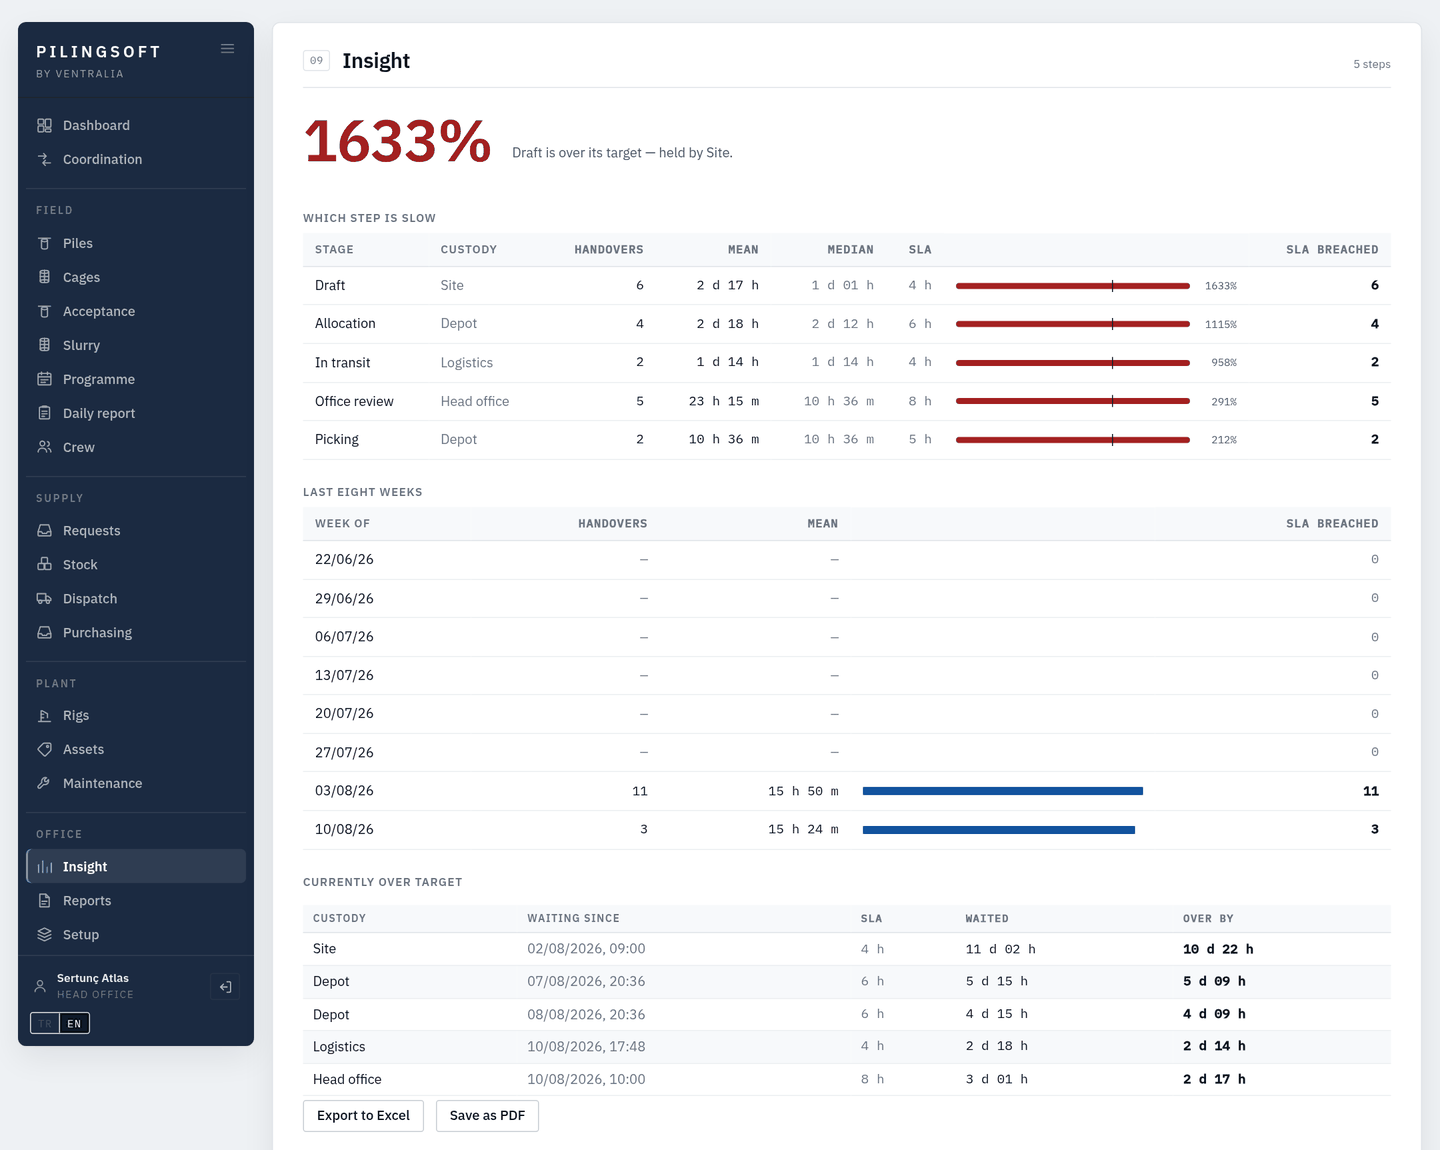
Insight — which stage is slow, and how far past its target.
Why it holds up

The report is derived, not retyped

The daily report reads the events the site already wrote. Typing it again would create a second version of the day, and the two would disagree.

Two versions of the same day is worse than none

One tap, or it will not be done

Attendance competes with the work itself. A screen that takes a minute per person is filled in on Friday for the whole week, and that is not a record.

A weekly guess reconciles with nothing

Analytics point at a stage, not a person

The question is which step is slow and who is holding the queue — a stage with a name, so it can be fixed rather than blamed.

A league table of people changes behaviour, not throughput

The other three modules

One ledger, four faces. A record written in one module is read by the next without being typed again.

See it on your own site.

Half an hour is enough: we enter one pile from your own project together, with your own figures.

Book a demo